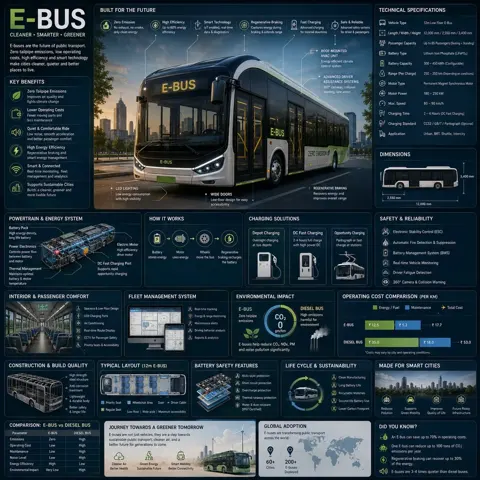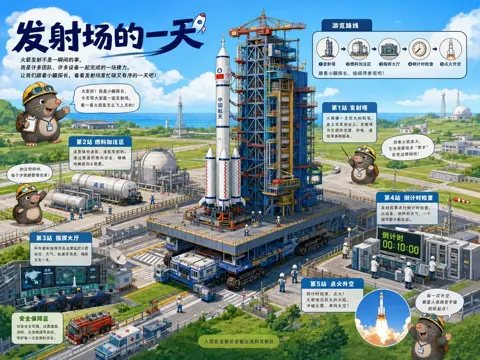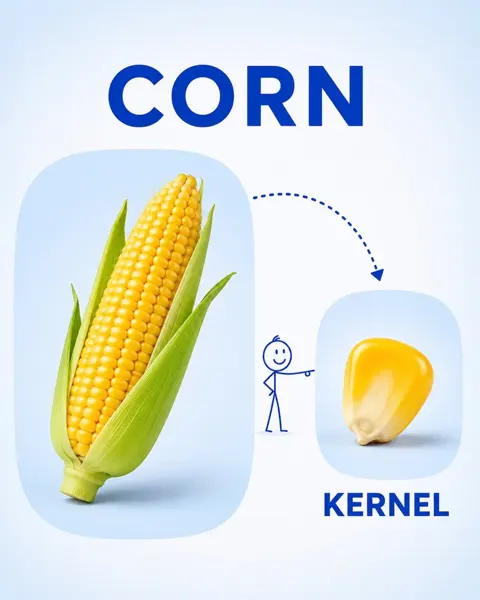
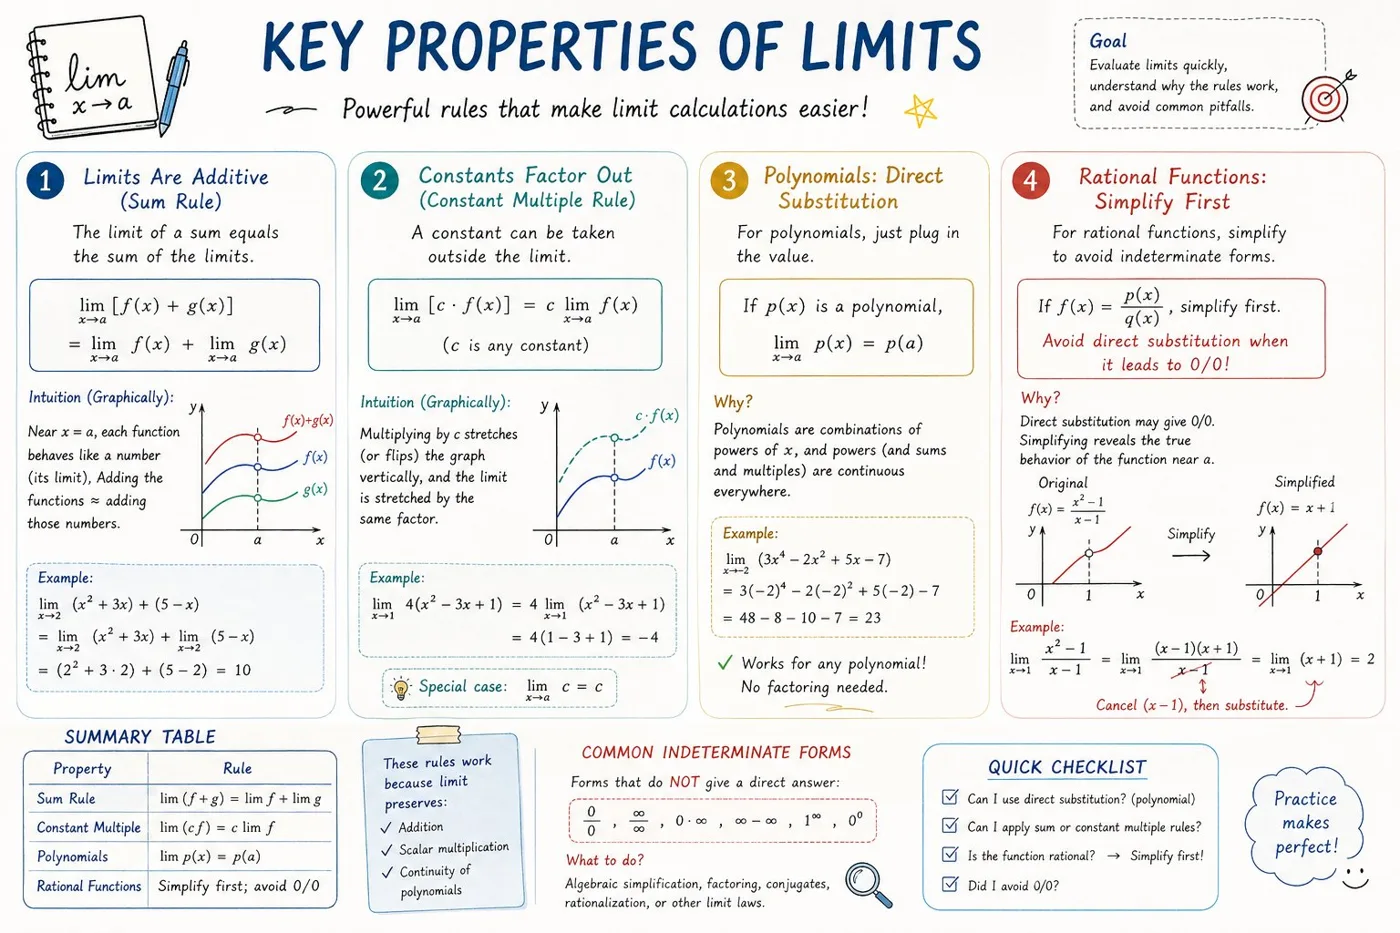
クリックで拡大表示 · 作例の参考イメージ
作例の出典
@hqmank ↗ · 作例 #341
オリジナルの作例内容を保持しています。生成結果はモデルのバージョン、参照画像、パラメータによって左右されます。本サイトでは個別の完全な再現を保証するものではありません。
インフォグラフィックス / PROMPT #341
AP Calculus 学習シートインフォグラフィック
画像を確認してからプロンプトをコピーしてください。プレースホルダーがある場合は、下部で内容を書き換えることができます。
01 / カスタマイズ
02 / プロンプト全文 · 原文
Please create a mathematical visualization infographic about "[math concept / topic]." The goal is to help the viewer intuitively understand what it is, why it works, its geometric or structural intuition, and how it behaves in different contexts. The visual should feel like a high-quality math lecture handout combined with a hand-drawn educational poster. It should be elegant, clear, and information-rich, but not cluttered. Visual style: either portrait or landscape is fine. Use a clean, light paper-like background, with a deep blue title and black or dark gray lines for the main content. Add a small number of refined accent colors such as blue, teal, gold, and red. Incorporate rounded-corner cards, thin borders, numbered labels, hand-drawn arrows, zoom-in callout boxes, and a summary section. The overall design should be aesthetically pleasing, balanced, and academic, allowing the viewer to grasp the structure of the concept and why it works at a glance.
お使いの画像生成ツールに貼り付けてご使用ください。本サイトはプロンプトの閲覧・編集ツールであり、画像の直接生成は行いません。
03 / 生成前のチェック
- プレースホルダーを具体的な内容に置き換え、参照画像が必要か確認します。
- 文字を含む場合はテキストを確定し、生成後に一文字ずつ確認します。
- 被写体、光、構図は一度に一箇所ずつ調整すると、効果を比較しやすくなります。
関連するインスピレーション
インフォグラフィックスの他の作例