
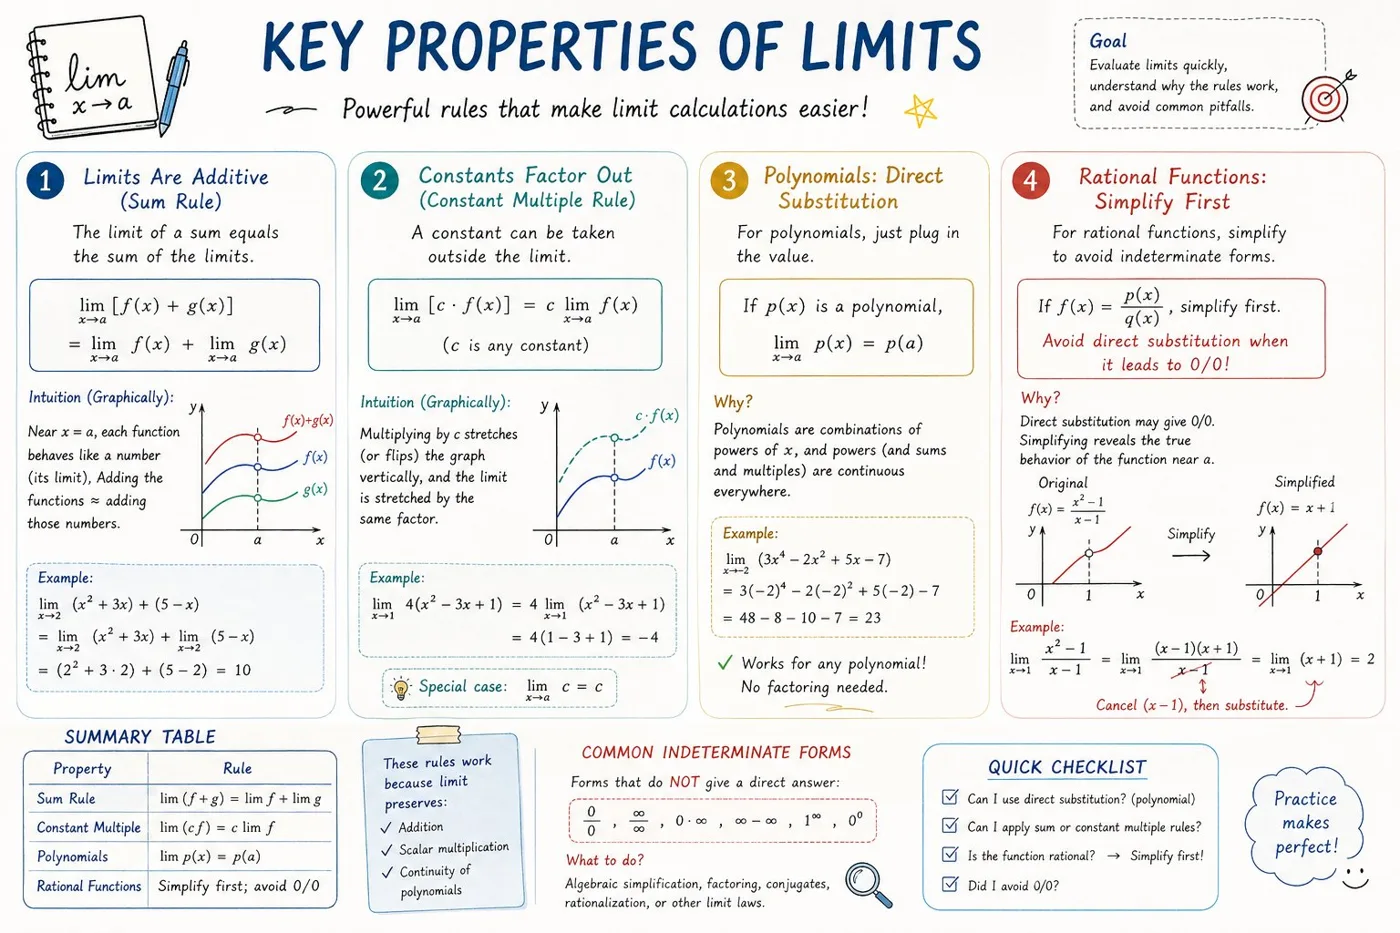
Click to view full image · Reference sample
Source
@hqmank ↗ · Case #341
Original prompt preserved. Results vary depending on model version, reference image, and parameters; identical outputs are not guaranteed.
Charts & Infographics / PROMPT #341
AP Calculus Study Sheet Infographic
Review the image, then copy the prompt. If placeholders are present, customize them below.
01 / Customize your version
02 / Full Prompt · Original
Please create a mathematical visualization infographic about "[math concept / topic]." The goal is to help the viewer intuitively understand what it is, why it works, its geometric or structural intuition, and how it behaves in different contexts. The visual should feel like a high-quality math lecture handout combined with a hand-drawn educational poster. It should be elegant, clear, and information-rich, but not cluttered. Visual style: either portrait or landscape is fine. Use a clean, light paper-like background, with a deep blue title and black or dark gray lines for the main content. Add a small number of refined accent colors such as blue, teal, gold, and red. Incorporate rounded-corner cards, thin borders, numbered labels, hand-drawn arrows, zoom-in callout boxes, and a summary section. The overall design should be aesthetically pleasing, balanced, and academic, allowing the viewer to grasp the structure of the concept and why it works at a glance.
Copy into your preferred AI image generator. Prompt Atelier provides prompt browsing and editing, but does not generate images directly.
03 / Pre-generation checklist
- Replace placeholders with specific details, and check whether reference images are needed.
- Specify exact wording for text elements, and proofread carefully after generation.
- Adjust only one element at a time—subject, lighting, or composition—to compare results easily.
Explore related inspiration
More in Charts & Infographics